Patent analysis method | technology source analysis
Original Ugliness & Strong Bureau Cat Teacher’s Patent Analysis Visualized in Topic # 28 Patent Analysis Methods and Tools
The country/region where the technology is applied for for the first time refers to which country/region the patented technology was put forward by the applicant, which is usually determined according to the country information in the priority number. The number of patent applications filed by the first-time applicant country/region reflects the country/region’s patent technology innovation ability and activity to a certain extent, which is often used to evaluate the overall technical strength, competitive position and development stage of the country/region in macro analysis.
01
—
Analysis of technical sources of global patent applications in countries or regions
When analyzing the situation of technology source, usually, the countries/regions with relatively high technical strength are initially delineated through ranking analysis, or the global strength positioning of the countries/regions specially selected for the purpose of analysis is determined. However, only by comparing the total amount of applications of each country/region, it is impossible to distinguish between "thin dead camel" and "new aristocrat", and it is also impossible to distinguish between "paper strength" and "real strength".
For the former, by increasing the time dimension, we can deeply observe the changing trend of patent applications from various technical sources, so as to find out whether the output climax of its patented technological achievements has passed or is in progress, so as to find out the countries with the most development potential or positive development momentum. In addition to the annual change, which is the most direct display method, data can also be converted. For example, the average annual growth rate of patent applications from various technology sources is calculated to compare the growth of patent applications in different places. If the average annual growth rate is greater than 0, the patent applications in this country/region show an increasing trend; if the average annual growth rate is less than 0, the patent applications in this country/region show a downward trend, thus showing the acceleration of the output of patented technological achievements more intuitively.
For the latter, it is usually necessary to use other evaluation indicators related to the quality of applications to more accurately characterize the height of technological innovation and the strength of scientific research and development, such as the number of citations, the number of families, the number of multilateral applications, the possibility of obtaining rights, and whether there are related products on the market. However, it is worth noting that there are many kinds of indicators that can be used to characterize the application quality, especially the connotation of each indicator does not have a recognized and unified definition. Therefore, in patent analysis, the appropriate types of indicators should be selected mainly according to the characteristics of the analyzed fields and data, and the corresponding definitions should be given in the analysis report.
Case 1: Analysis of the main sources of assistive devices and technologies for the visually and hearing impaired.
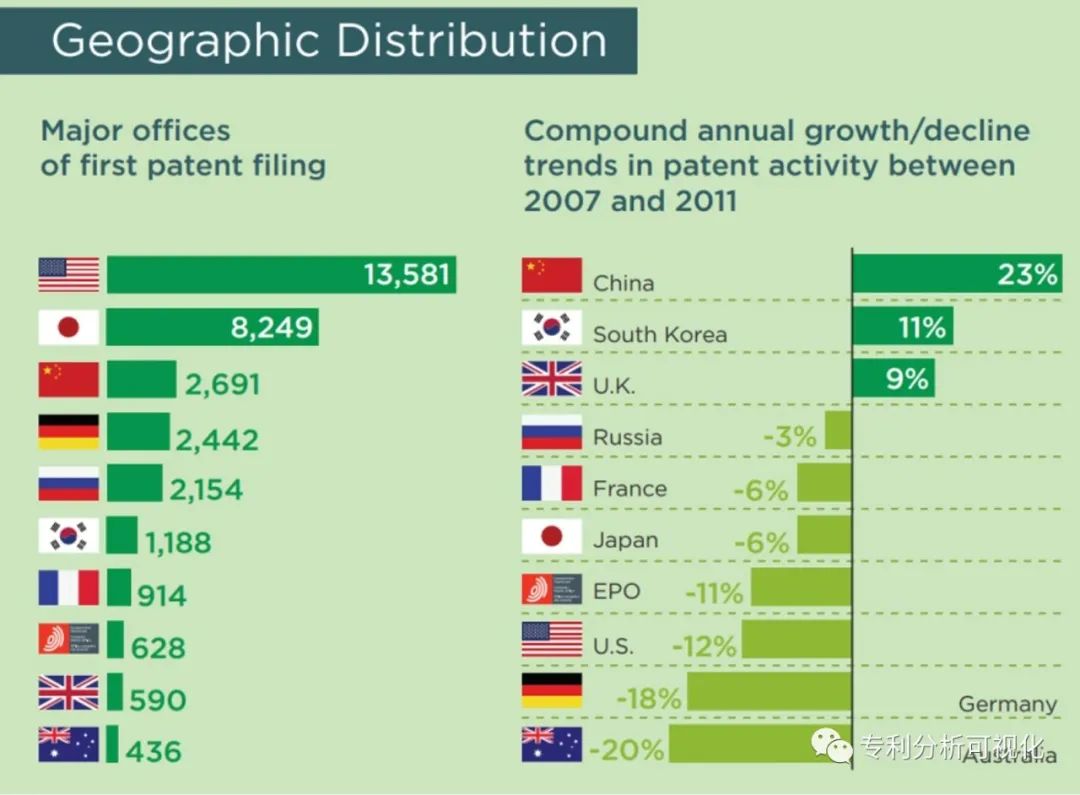
The number of applications from major sources in the field of assistive devices and technologies for the visually and hearing impaired and their changing trends.
Chart source: WIPO patent landscape report on assistive devices and technologies for visually and hearing affected persons.
From 2007 to 2011, among the main technical sources in the field of assistive devices and technologies for visually and hearing-impaired people, the United States ranked first, with 13,581 applications; Followed by Japan, with 8249 applications; Although China ranks third, the number of applications is only 2,691, which is not far from the top two countries, such as the United States and Japan. It shows that in the field of assistive devices and technologies for the visually impaired and hearing impaired, the national strength is obviously unbalanced, and there is a big difference between echelons. The United States is strong and stands out, and few countries can compete with it.
However, from the perspective of growth rate, the number of applications in this field in China, South Korea and the United Kingdom is increasing, while the growth rate of applications in other countries and regions has declined, especially in Australia, Germany and the United States, indicating that China is making rapid development in this field, which belongs to the rising period of technology research and development. Although its current strength is still insufficient, its future can be expected.
Case 2: Application trend of global patent application sources in artificial intelligence field
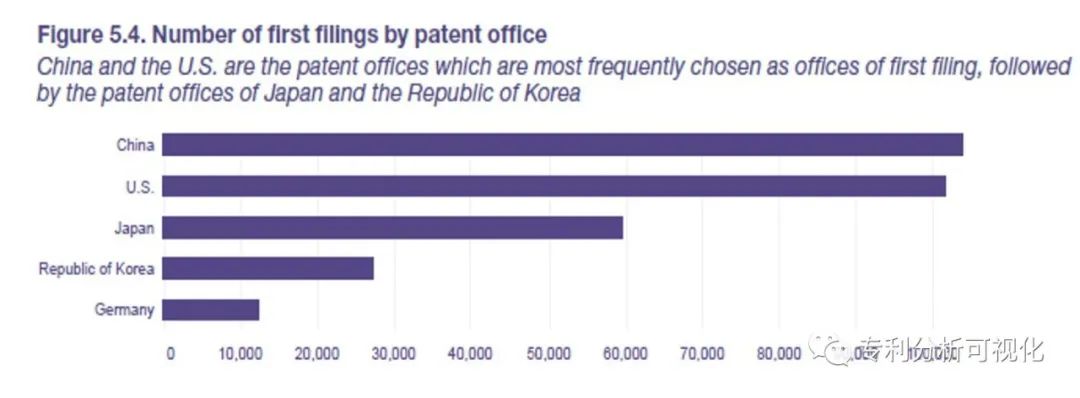
Ranking of the number of first-time applications accepted by the world’s major acceptance bureaus in the field of artificial intelligence
Chart source: WIPO Technology Trends 2019: Artificial Intelligence
In the field of artificial intelligence, the number of patented technologies in China is slightly better than that in the United States, ranking first in the world, while Japan and South Korea rank third and fourth respectively. However, there is a certain gap in the total number of applications compared with China and the United States, and the top 10 major countries/regions account for 97% of all AI patent applications (with 328,935 patent families), while the top four countries (China, Japan, South Korea and the United States) together account for 80% of the total. It can be seen that there are not many countries/regions that can compete in the field of artificial intelligence at present.
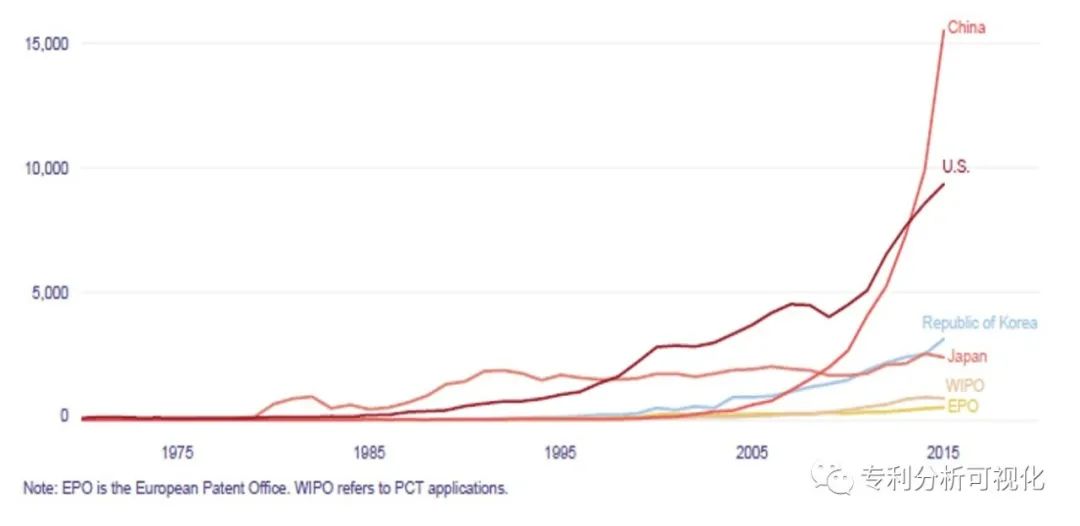
Changes in the number of first-time applications accepted by the world’s major acceptance bureaus in the field of artificial intelligence
Chart source: WIPO Technology Trends 2019: Artificial Intelligence
A further analysis of the time distribution of applications shows that Japan and the United States reached the threshold of accepting 200 applications in 1979 and 1986 respectively, while China only reached this threshold in 2002, with a time lag of about 20 years compared with the United States and Japan, but it has grown extremely rapidly in recent years, with an exponential growth trend in the past 10 years. Since 2013, the number of first-time applications in China has surpassed that in the United States, and the average annual growth rate of first-time applications since 2013 is as high as 43%. By 2016, the number of first-time applications in the AI field in China has reached 33,000.
On the contrary, although Japan was one of the first countries to innovate in the field of AI (in the early 1980s), the number of its applications has remained relatively stable in recent years after a brief decline from 1982 to 1986 and a rapid increase from 1986 to 1991. Applications in the United States also appeared earlier (in the mid-1980s), and have been growing continuously since then, except for the fluctuations in the number of applications during 2000 -2002 and 2008 -2012 due to economic impact. The growth rate of applications in South Korea was significantly accelerated around 2002, while PCT patent applications grew strongly after 2010.
Multi-index dimension analysis of global patent application source in artificial intelligence field
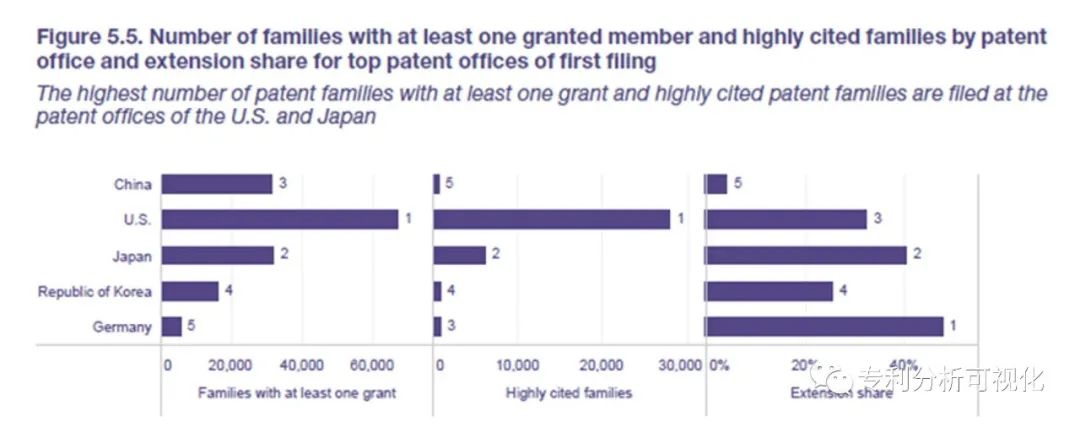
Chart source: WIPO Technology Trends 2019: Artificial Intelligence
Comprehensive analysis is made by using three indicators: at least one authorization, high-frequency cited patent family and multilateral application.
At least one authorization: Families with at least one grant, that is, at least one patent in the same family has been granted a patent right, reflecting the innovation of the technology involved);
High-frequency cited patent families: Highly cited families, that is, patent families that have been cited for at least 20 times by later published patent applications, reflect the importance of the technology involved;
Multilateral application: Extension share, that is, a patent family that has entered more than two countries or regions, indicates that it hopes to commercialize inventions in multiple markets.
It can be found that although China ranks first in the number of patent applications in the field of artificial intelligence, if the above three indicators are considered, its ranking will drop significantly: only 4% of China applicants will subsequently enter other countries after submitting their patent applications for the first time, while the proportion of applicants from other countries has reached 25%-63%; In terms of the number of at least one patent family authorized by the same family, China ranks third among the five bureaus; Ranked first from the bottom in the number of patent families cited in high frequency. The reasons for this phenomenon may be that China applicants are more interested in the domestic market than overseas markets, and China applicants submitted their applications in this field relatively late, so the number of authorizations and the frequency of citations are relatively low.
Case 3: Comparison of patent application structure of main technical sources of silicon carbide preparation technology
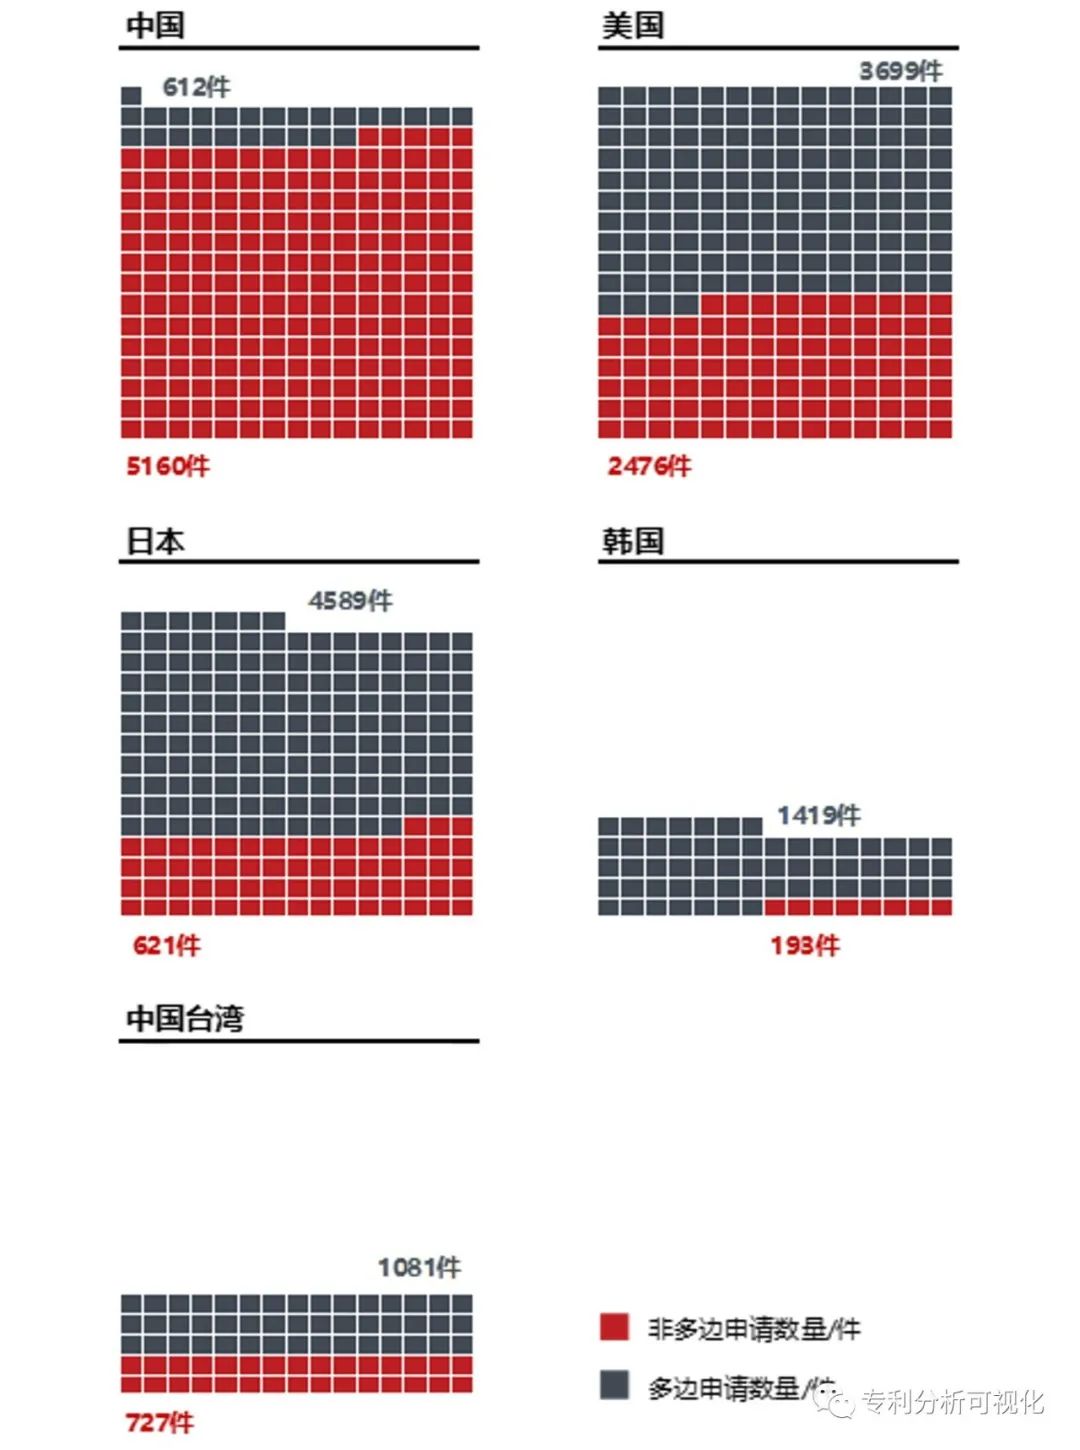
Comparison of national patent application structure (multilateral application and non-multilateral application) of main technical sources of silicon carbide preparation technology
Chart Source: China National Intellectual Property Administration Academic Committee. Industrial Patent Analysis Report (Volume 67) Third Generation Semiconductor [M]. Beijing: Intellectual Property Press, 2019.
By comparing the patent application structures of the main technical sources of silicon carbide preparation technology, it can be seen that the total number of applications for silicon carbide in China is 5772, but only 612 are multilateral applications, accounting for only 10.7% of the total; The total number of applications for silicon carbide in the United States is 6,175, of which 3,699 are multilateral applications, accounting for 59.9% of the total. Although there are a large number of patent applications in China, they are mainly concentrated in the domestic market, and there are few overseas patent applications, which may lead to the lack of adequate patent protection and huge patent risks for China enterprises when they enter overseas markets; However, the United States, Japan and South Korea have more multilateral applications, which can provide a strong guarantee for the healthy development of overseas markets, except that their own countries attach great importance to overseas market applications. Among them, the patent application structure refers to the proportion of multilateral applications and non-multilateral applications, while multilateral applications refer to patent families entering more than three countries.
02
—
Analysis on the technical sources of China’s application.
For patent applications in China, the country/region of technology origin or the province/city of technology origin is usually analyzed in the process of patent analysis, but the country of technology origin and the province of technology origin are actually two completely different perspectives. Since China patent applications from other countries/regions in China only account for a part of the patent technology achievements, the ranking of China patent applications from other countries/regions can not truly reflect their actual technical strength, but only reflect their willingness and ability to obtain patents for the China market, that is, the strength of patent layout. In contrast, influenced by the traditional patent application habits and the provisions of Article 20 of the Patent Law on confidentiality review, domestic applicants usually give priority to filing patent applications in China for their technologies, so the number of patent applications from provinces/cities with technology sources can usually truly reflect the patent technology research and development capabilities of each province/city.
Case 4: The distribution of patent applicants in China in 4:FinFET field.
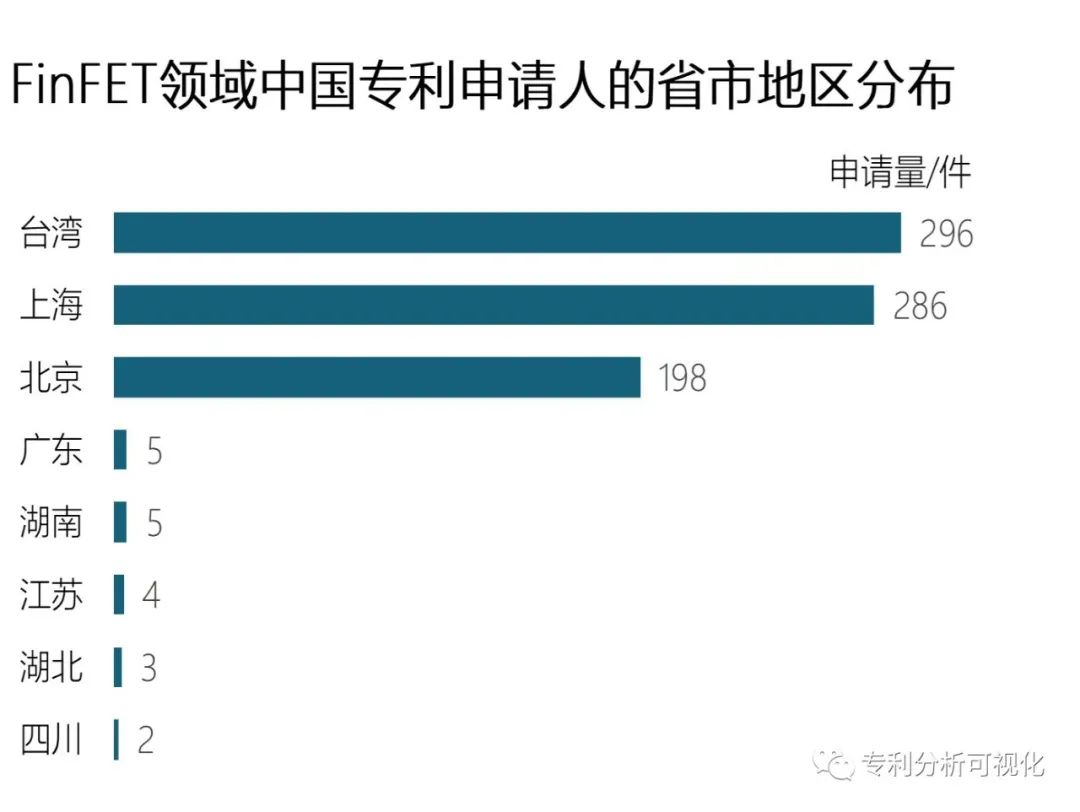
Distribution of patent applicants in China in FinFET field by provinces, cities and regions
Chart Source: Yang Tiejun. Industrial Patent Analysis Report (Volume 40) High-end General Chip [M]. Beijing: Intellectual Property Press, 2016.
Among China applicants in FinFET technology field, Taiwan Province ranks first. TSMC and Lianhua Electronics from Taiwan Province are world-renowned foundry enterprises in semiconductor field, with broad business scope and strong scientific research capabilities. TSMC, in particular, has been at the forefront of advanced semiconductor technology in recent years. Except Taiwan Province, applications from mainland China are mainly concentrated in Shanghai and Beijing. Shanghai is due to the concentration of semiconductor industry, while Beijing has more research institutes and universities. It can be seen that, like the global trend, China’s domestic industries have also been highly differentiated and gathered.
For more details, please pay attention to the Practical Manual of Patent Analysis (Second Edition).
Catalogue of this book
Chapter 1: Basic concepts, methods and application scenarios of patent analysis.
1.1 Basic concepts of patent analysis
1.2 the basic way of patent analysis
1.3 dialectical understanding of patent analysis and patent statistics
1.4 Common application scenarios of patent analysis
Chapter 2 patent analysis process and project management
2.1 the overall process of patent analysis
2.2 Preparation of resources for patent analysis
2.3 Project Management of Patent Analysis
2.4 Key links of patent analysis
2.5 Application of the Achievements of Patent Analysis Project
Chapter 3 Industry Survey
3.1 The main contents of industry survey
3.2 The main ways of industry survey
3.3 Writing of Industry Investigation Report
Chapter 4 Decomposition of Patent Technology
4.1 Overview of Patent Technology Decomposition
4.2 Process of Patent Technology Decomposition
4.3 Method of Patent Technology Decomposition
4.4 Examples of Patent Technology Decomposition
Chapter 5 Patent Analysis, Retrieval and Evaluation
5.1 Overview of Patent Analysis and Retrieval
5.2 Patent Analysis and Retrieval Process
5.3 Introduction to the Use of Patent Analysis Database
5.4 Basic retrieval strategy
5.5 Selection of retrieval elements
5.6 the construction of retrieval type
5.7 Patent Analysis, Retrieval and Evaluation
5.8 Writing of Patent Analysis and Retrieval Report
Chapter 6 Data Processing
6.1 Overview of data processing
6.2 data acquisition
6.3 data cleaning
6.4 data indexing
Chapter 7 Visualization of Patent Analysis
7.1 Overview of patent analysis visualization
7.2 Basic contents of patent analysis visualization
7.3 Visual Interpretation of Patent Analysis
Chapter 8 Patent Analysis Methods
8.1 Statistical Analysis of Description Items
8.2 Technical Indexing Item Analysis
8.3 Analysis of Rights Indexing Items
8.4 Characteristic analysis method
Chapter 9 Writing of Patent Analysis Report
9.1 Basic Process
9.2 General requirements
9.3 reporting framework
9.4 Writing of main content
Chapter 10 Conclusion
10.1 Catch the "anomaly"-what to see?
10.2 Looking for "meaning"-what to write?
10.3 Keep "Action"-Do what?
Appendix: Basic Usage of Patent Database
It is everyone’s responsibility to protect copyright.
Xiaobian’s painstaking efforts, refusing to steal pictures, if you need to reprint, contact the background ↑ long press the identification QR code to follow ↑.
Micro-signal: patent analysis visualization
Original title: Patent Analysis Method | Technology Source Analysis
Read the original text